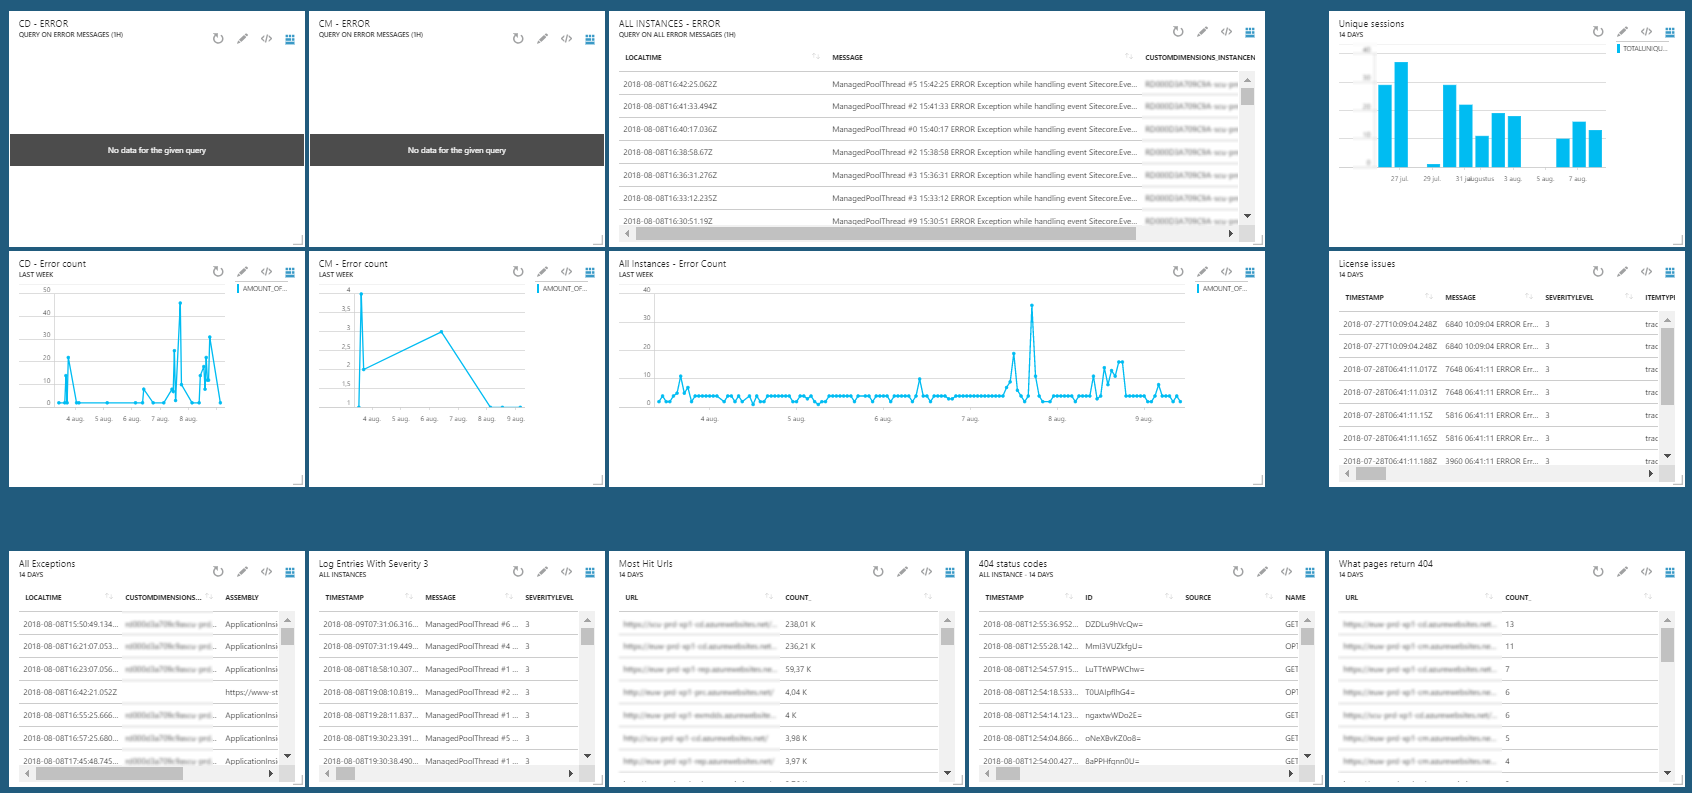
While using Sitecore on Azure you will most likely be able to find your way around using Application Insights. Keeping your Sitecore instances running smooth will, however, require you to check the available logs on a regular base. The most common way to check your environment is to browse trough AI within the Azure Portal. Given the fact you are using AI as ALM monitoring, obviously.
To give you a quick overview on your Sitecore environment I will give you some useful query’s. I would love to receive helpful query’s as well and will append them to this post whenever you hand them over.
First I will give you a screenshot of the current dashboard we are using to check our Sitecore production environment and keeping it running smooth:  The query’s necessary to build a dashboard like illustrated above will follow below:
Check your CD(s) for errors:
traces | where timestamp > ago(1d) | where message contains “ERROR” | where (customDimensions).Role contains “CD” | project timestamp, message, (customDimensions).InstanceName | order by timestamp desc
To create a better overview on ERRORS you could extend the timespan and render the query using, for example, a timechart.
traces | where timestamp > ago(144h) | where message contains “ERROR” | where (customDimensions).Role contains “CD” | extend localTime = timestamp + 1h | summarize Amount_Of_Errors=dcount(message) by bin(localTime, 1h) | order by localTime asc | render timechart
Check your CM(s) for errors:
traces | where timestamp > ago(1d) | where message contains “ERROR” | where (customDimensions).Role contains “CM” | project timestamp, message, (customDimensions).InstanceName | order by timestamp desc
To create a better overview on ERRORS you could extend the timespan and render the query using, for example, a timechart.
traces | where timestamp > ago(144h) | where message contains “ERROR” | where (customDimensions).Role contains “CM” | extend localTime = timestamp + 1h | summarize Amount_Of_Errors=dcount(message) by bin(localTime, 1h) | order by localTime asc | render timechart
Check all instances for errors: * please note I extend to use a localTime in some of the querys
traces | where timestamp > ago(1d) | extend localTime = timestamp + 1h | where message contains “ERROR” | where message !contains “INFO” and message !contains “WARN” | project localTime, message, (customDimensions).InstanceName | order by localTime desc
To create a better overview on ERRORS you could extend the timespan and render the query using, for example, a timechart.
traces | where timestamp > ago(144h) | where message !contains “INFO” and message !contains “WARN” and message !contains “Could not update device detection” | extend localTime = timestamp + 1h | summarize Amount_Of_Errors=dcount(message) by bin(localTime, 1h) | order by localTime asc | render timechart
Check your environment on exceptions:
exceptions | where timestamp > ago(14d) | extend localTime = timestamp + 1h | project localTime, (customDimensions).MachineName, assembly, outerMessage
Check your environment on log entry’s with severity > 3:
traces | where severityLevel >= 3
What are the most hit Urls:
requests | where timestamp > ago(14d) | summarize count() by url | order by count_ desc | project url, count_
Give me all 404 status codes:
requests | where timestamp > ago(14d) | extend localTime = timestamp + 1h | where resultCode == “404” | order by localTime desc
and summarize the Urls including a count
requests | where timestamp > ago(14d) | where resultCode == “404” | summarize count() by url | order by count_ desc | project url, count_
Sitecore depends a lot on correct license configuration, keep misconfigurations/issues under your radar:
traces | where timestamp > ago(14d) | where message contains “license” and severityLevel > 1
How many unique sessions hit my environment:
pageViews | where timestamp > ago(14d) | summarize TotalUniqueSessions = dcount(session_Id) by bin(timestamp, 1d) | order by timestamp asc | render barchart kind=default
A helpful sheet on building query’s within application insights can be found here: Download
By using the query’s above we found a whole lot of improvements which gave us the ability to further improve the environments of our customers. As mentioned before, please provide me with your scripts whenever you feel like it would add value to the ones already mentioned in this post.